
В
Ландос же. Так а ты попробуй сложный spa сайт написать, с разнообразным функционалом и ещё обязательно скрипты аналитики не забудь туда засунуть
Size: a a a
В
CG
const responseFormat = await response.text();
    parent.innerHTML += responseFormat;
И я ожидаю, что он начнет выполняться, но это не так. Код, который его вставлял продолжает выполнение. В то время, как сценарий вставляемого кода ещё не отыграл. Из-за чего я получаю ошибкиCG
DE
const responseFormat = await response.text();
    parent.innerHTML += responseFormat;
И я ожидаю, что он начнет выполняться, но это не так. Код, который его вставлял продолжает выполнение. В то время, как сценарий вставляемого кода ещё не отыграл. Из-за чего я получаю ошибкиCG
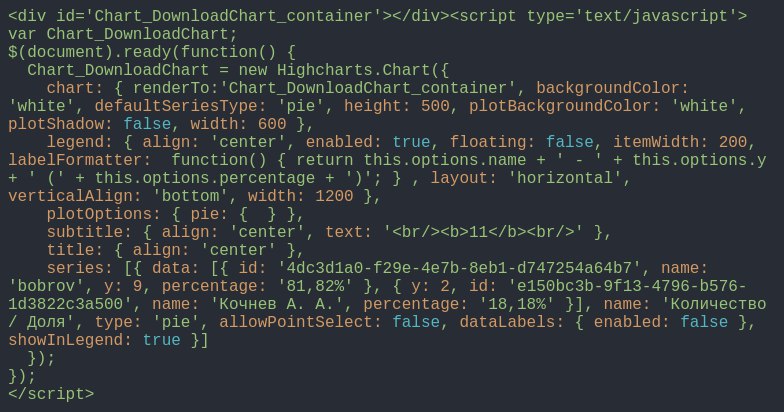
<div id='Chart_DownloadChart_container'></div><script type='text/javascript'>
var Chart_DownloadChart;
$(document).ready(function() {
  Chart_DownloadChart = new Highcharts.Chart({
    chart: { renderTo:'Chart_DownloadChart_container', backgroundColor: 'white', defaultSeriesType: 'pie', height: 500, plotBackgroundColor: 'white', plotShadow: false, width: 600 },
    legend: { align: 'center', enabled: true, floating: false, itemWidth: 200, labelFormatter:  function() { return this.options.name + ' - ' + this.options.y + ' (' + this.options.percentage + ')'; } , layout: 'horizontal', verticalAlign: 'bottom', width: 1200 },
    plotOptions: { pie: {  } },
    subtitle: { align: 'center', text: '<br/><b>11</b><br/>' },
    title: { align: 'center' },
    series: [{ data: [{ id: '4dc3d1a0-f29e-4e7b-8eb1-d747254a64b7', name: 'bobrov', y: 9, percentage: '81,82%' }, { y: 2, id: 'e150bc3b-9f13-4796-b576-1d3822c3a500', name: 'Кочнев А. А.', percentage: '18,18%' }], name: 'Количество / Доля', type: 'pie', allowPointSelect: false, dataLabels: { enabled: false }, showInLegend: true }]
  });
});
</script>
S
<div id='Chart_DownloadChart_container'></div><script type='text/javascript'>
var Chart_DownloadChart;
$(document).ready(function() {
  Chart_DownloadChart = new Highcharts.Chart({
    chart: { renderTo:'Chart_DownloadChart_container', backgroundColor: 'white', defaultSeriesType: 'pie', height: 500, plotBackgroundColor: 'white', plotShadow: false, width: 600 },
    legend: { align: 'center', enabled: true, floating: false, itemWidth: 200, labelFormatter:  function() { return this.options.name + ' - ' + this.options.y + ' (' + this.options.percentage + ')'; } , layout: 'horizontal', verticalAlign: 'bottom', width: 1200 },
    plotOptions: { pie: {  } },
    subtitle: { align: 'center', text: '<br/><b>11</b><br/>' },
    title: { align: 'center' },
    series: [{ data: [{ id: '4dc3d1a0-f29e-4e7b-8eb1-d747254a64b7', name: 'bobrov', y: 9, percentage: '81,82%' }, { y: 2, id: 'e150bc3b-9f13-4796-b576-1d3822c3a500', name: 'Кочнев А. А.', percentage: '18,18%' }], name: 'Количество / Доля', type: 'pie', allowPointSelect: false, dataLabels: { enabled: false }, showInLegend: true }]
  });
});
</script>
DE
<div id='Chart_DownloadChart_container'></div><script type='text/javascript'>
var Chart_DownloadChart;
$(document).ready(function() {
  Chart_DownloadChart = new Highcharts.Chart({
    chart: { renderTo:'Chart_DownloadChart_container', backgroundColor: 'white', defaultSeriesType: 'pie', height: 500, plotBackgroundColor: 'white', plotShadow: false, width: 600 },
    legend: { align: 'center', enabled: true, floating: false, itemWidth: 200, labelFormatter:  function() { return this.options.name + ' - ' + this.options.y + ' (' + this.options.percentage + ')'; } , layout: 'horizontal', verticalAlign: 'bottom', width: 1200 },
    plotOptions: { pie: {  } },
    subtitle: { align: 'center', text: '<br/><b>11</b><br/>' },
    title: { align: 'center' },
    series: [{ data: [{ id: '4dc3d1a0-f29e-4e7b-8eb1-d747254a64b7', name: 'bobrov', y: 9, percentage: '81,82%' }, { y: 2, id: 'e150bc3b-9f13-4796-b576-1d3822c3a500', name: 'Кочнев А. А.', percentage: '18,18%' }], name: 'Количество / Доля', type: 'pie', allowPointSelect: false, dataLabels: { enabled: false }, showInLegend: true }]
  });
});
</script>
CG
$(parent).append(responseFormat);CG
CG
DE
DE
CG
DE
CG
DE
DE
CG
DE
CG